See competitor unit pricing information and performance data so you can make better business decisions

When it comes to decision-making, data is power. And there’s no shortage of data in the comprehensive monthly reports generated by Lightspeed’s automated benchmarking service. These reports show how your dealership compares nationally See competitor unit pricing information and performance data so you can make better business decisions in performance and profitability, and help you identify areas for improvement. Our new functionality lets you see what other dealers are charging for products so you can price competitively and ultimately make more money!
A Closer Look at What’s New
Brings the power of benchmarking data into the sales deal
The newest Lightspeed Industry Benchmarks release integrates real product selling price information into individual sales deals. That means when you’re handling a lead, quote or deal you can see what other dealers in your region and across the country are pricing that same make, model and new vs. used status.

See industry pricing
You can access competitive pricing information by hovering over the price field. You’ll see the National Selling Price and the Regional Selling Price for units that are VIN decoded. If the price box is outlined in red, that’s a clue you could be getting more for the product.
When you adjust the price to be more in line with your competitors, that line will turn green.

This pricing information allows you to negotiate the price of the unit more easily and be confident in what you’re doing.

See add-ons as well
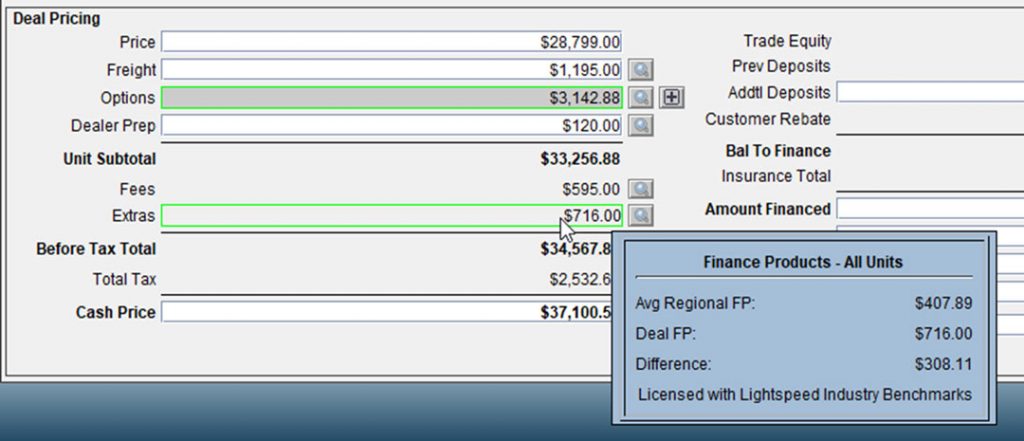
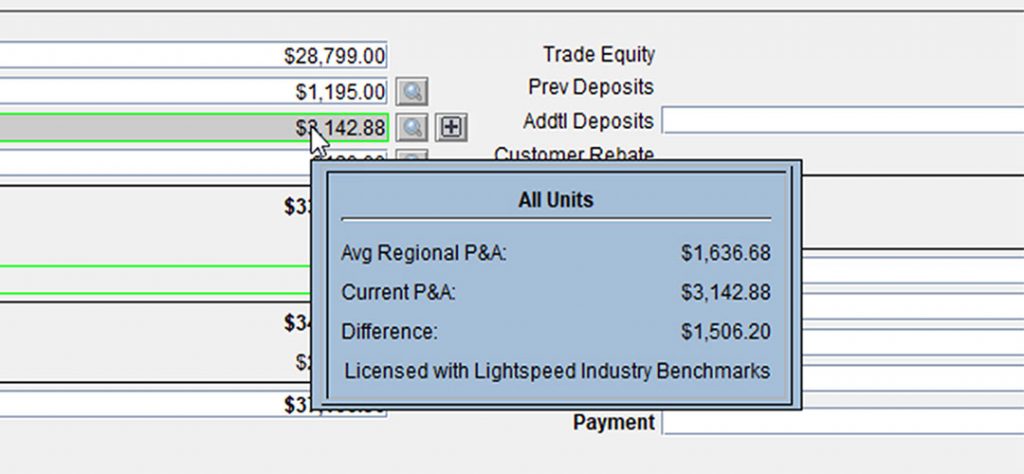
When you hover over the “options” line, you’ll see what other dealers are adding onto the deal, such as parts and accessories and finance products. This information lets you know how much a typical customer is willing to add to the purchase, and allows you to sell add-ons more confidently.

See the whole deal
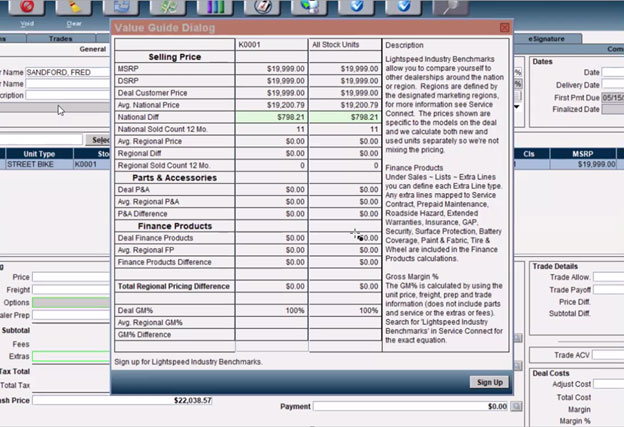
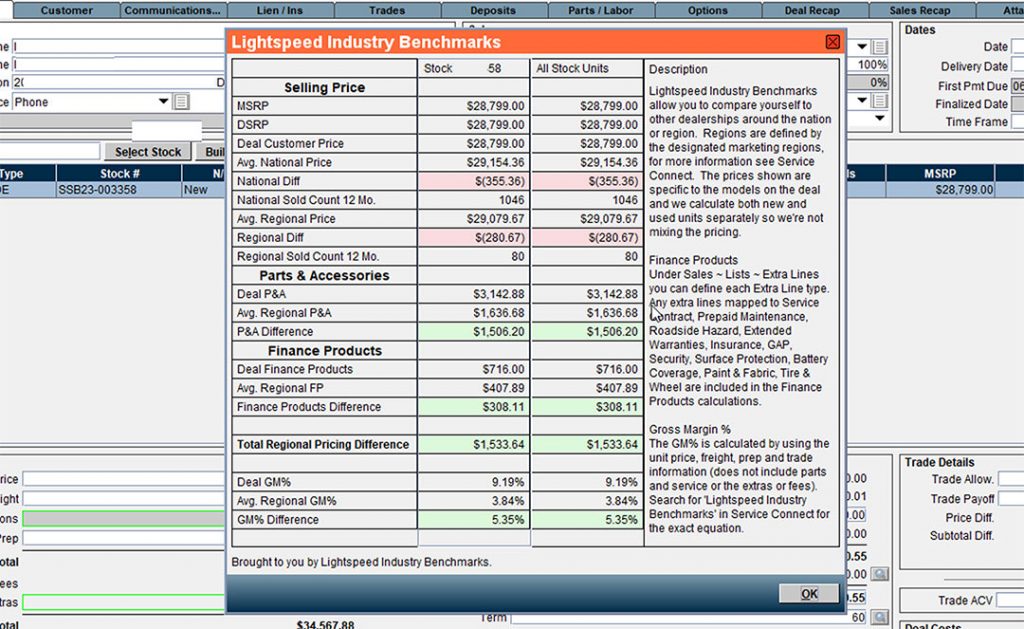
We’ve added a new selection called Benchmarks so you can see the entire deal in one view. Here you’ll see pricing for each unit in the deal. Red color coding indicates where your pricing is below competitors. The Total Regional Price difference indicates how much more you could be making (if it’s red) or how much more you made compared to other dealers (if it’s green.)

